
How to Use Better Stack: A Complete Beginner’s Guide
Website downtime, slow response times, and unexpected server failures can quickly impact your business, damage customer trust, and reduce revenue. If you rely on multiple tools to monitor uptime, manage incidents, analyze logs, and notify your team, keeping track of everything can become time-consuming and overwhelming. Even worse, delayed or missed alerts can leave critical issues unnoticed until users start reporting them.
By TechScaleMedia Editorial · Updated July 2026 · 11 min read
That’s where Better Stack comes in. Better Stack is a unified observability platform that combines uptime monitoring, incident management, log management, hosted status pages, and on-call alerting into a single, easy-to-use dashboard. It continuously checks your websites, APIs, and servers from multiple monitoring locations worldwide, verifies outages to reduce false alarms, and instantly alerts your team through channels like Slack, Microsoft Teams, email, SMS, phone calls, Discord, and PagerDuty. Whether you’re managing a personal website, SaaS application, or enterprise infrastructure, Better Stack helps you detect problems faster, respond to incidents more efficiently, and keep your services available around the clock.
Ready to improve your website and infrastructure monitoring? Follow the step-by-step guide below to set up Better Stack and start tracking your services in just a few minutes.
Quick Answer
Using Better Stack involves creating an account, adding your website, API, or server, configuring uptime monitoring, setting alert notification channels, creating incident escalation policies, connecting logs, and reviewing performance reports from a centralized dashboard. Once everything is configured, Better Stack continuously monitors your infrastructure, verifies incidents to minimize false positives, and sends real-time alerts so you can resolve issues before they affect your users.
Prerequisites
Before getting started, make sure you have:
- A Better Stack account
- Your website URL, API endpoint, or server IP address
- Access to your DNS or server (if required)
- Email, Slack, Microsoft Teams, or another notification service
- A stable internet connection
Create a Workflow Manually (Recommended for Beginners)
If you’re new to infrastructure monitoring, setting up your first Better Stack monitor is the best way to understand how the platform works:
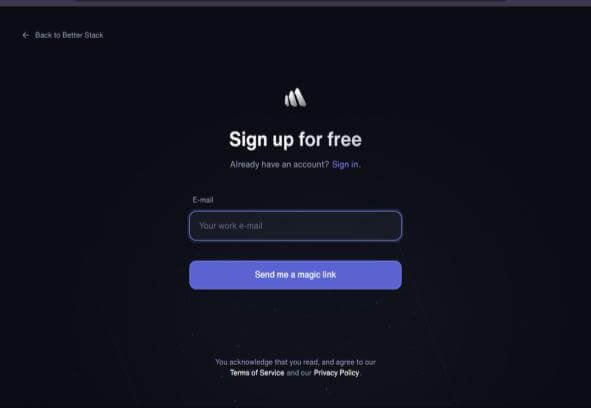
Step 1: Create Your Better Stack Account
Visit the Better Stack website and click Sign Up. Create an account using your email address or sign in with a supported provider, then verify your email and log in to your dashboard.
After signing in, you’ll be taken to your Better Stack workspace, where you can manage monitors, alerts, logs, incident response, and status pages from a single interface.
Step 2: Add Your Website, API, or Server
From the dashboard, click New Monitor to begin monitoring your first service.
Better Stack supports several monitor types, including:
- HTTP and HTTPS websites
- REST API endpoints
- Ping monitoring
- TCP port monitoring
- Heartbeat monitors
- SSL certificate monitoring
Enter your website URL, API endpoint, or server details, choose a monitoring interval, and save the monitor.
Better Stack immediately begins checking your service from multiple global monitoring locations to detect outages and performance issues.
Step 3: Configure Uptime Monitoring
Open your monitor settings and customize how Better Stack checks your service.
You can configure options such as:
- Monitoring frequency
- Request timeout
- Expected HTTP status codes
- SSL certificate expiration monitoring
- Keyword validation
- Geographic monitoring regions
Properly configuring these settings helps reduce false alerts while ensuring Better Stack accurately detects real service interruptions.
Step 4: Configure Alert Notifications
Receiving alerts quickly is essential when your website or application experiences downtime.
Open the Alerting section and connect one or more notification channels.
Better Stack supports:
- Slack
- Microsoft Teams
- Discord
- SMS
- Phone Calls
- PagerDuty
- Webhooks
Once configured, test each notification channel to verify your team receives alerts immediately whenever an incident occurs.
Step 5: Create Incident Escalation Policies
Incident escalation policies ensure important alerts never go unnoticed.
Create rules such as:
- Notify the primary responder immediately.
- Escalate after five minutes if unresolved.
- Notify another engineer or manager.
- Trigger automated phone calls for critical incidents.
These policies help your team respond faster and minimize service disruptions.
Step 6: Connect Log Management
Better Stack also provides centralized log management, allowing you to investigate problems without switching between multiple tools.
Connect your application, server, or cloud platform to begin collecting logs.
Once connected. you can:
- Search logs instantly.
- Filter by application, service, or severity.
- Investigate errors.
- Analyze application behavior.
- Troubleshoot production issues more efficiently.
Having logs and monitoring data in one place significantly reduces troubleshooting time.
Step 7: Create a Hosted Status Page
Keep customers informed during maintenance or unexpected outages by creating a hosted status page.
Customize your page by adding:
- Monitored services
- Uptime history
- Scheduled maintenance announcements
- Incident updates
- Branding and company information
Your status page automatically reflects your monitoring data, helping improve transparency with customers.
Step 8: Review Reports and Performance Metrics
Once your monitors are running, regularly review your dashboard to understand your application’s overall health.
Track important matrics such as:
- Overall uptime percentage
- Average response time
- Downtime history
- Incident timeline
- SSL certificate health
- Performance trends
These insights help identify recurring issues and improve long-term application reliability.
You’re Ready to Start Monitoring with Better Stack.
Ready to monitor your infrastructure and resolve incidents faster?
Set up your first Better Stack monitor in minutes and keep your applications, servers, and websites running reliably.
Tips to Get the Most Out of Better Stack
These expert tips will help you configure Better Stack more effectively for faster monitoring, reliable alerts, and improved system uptime:
- Start with your most critical websites and APIs before adding less important services.
- Use descriptive names and tags to keep monitors organized.
- Create separate notification groups for development, operations, and management teams.
- Customize dashboards to quickly view the health of your most important services.
- Test alerts after creating a new monitor to confirm notifications work correctly.
- Use hosted status pages to keep customers informed during outages or scheduled maintenance.
These features can save hours of manual monitoring and help you maintain more reliable systems and infrastructure.
Common Pabbly Connect Mistakes to Avoid
Better Stack is easy to set up, but small configuration mistakes can affect monitoring and alerts. Avoid these common errors.
- Using long monitoring intervals.
- Forgetting to verify notification channels.
- Ignoring incident reports.
- Not configuring escalation policies.
- Monitoring only your homepage instead of critical endpoints.
Best Practices for Building Reliable Automations
Once your workflows are running, these long-term practices keep your automations organised, scalable, and easy to maintain.
- Monitor all critical services, including APIs, databases, SSL certificates, and background jobs for complete visibility.
- Configure smart escalation policies to automatically notify additional team members during unresolved incidents.
- Analyze uptime and performance trends to identify recurring issues before they become critical problems.
- Centralize monitoring and logs for faster troubleshooting from a single unified dashboard.
- Keep monitoring configurations updated as your infrastructure grows and changes.
- Review monitoring reports regularly to improve system availability, response times, and overall reliability.
Troubleshooting Common Better Stack Issues
If your automation isn’t working as expected, these quick fixes can help.
Better Stack Isn’t Detecting My Website
Verify your website URL and ensure it’s publicly accessible.
Alerts Aren’t Being Sent
Check your notification channels and confirm they are properly configured.
Monitoring Reports Show False Downtime
Review firewall settings, DNS configuration, and timeout settings.
Logs Aren’t Appearing
Verify your log integration and ensure logs are being sent successfully.
Frequently Asked Questions
Is Better Stack free?
Yes. Better Stack offers a free plan with basic monitoring features, while advanced observability and collaboration features are available on paid plans.
Can Better Stack monitor APIs?
Yes. Better Stack supports monitoring websites, APIs, servers, TCP services, and heartbeat monitors.
How does Better Stack work?
Better Stack continuously monitors your websites, APIs, and servers from multiple global locations. When it detects an issue, it verifies the incident to reduce false alerts and instantly notifies your team through channels like email, Slack, SMS, or phone calls. It also provides logs, incident management, and status pages to help you resolve problems quickly.
Does Better Stack send instant alerts?
Yes. Alerts can be delivered through email, Slack, Microsoft Teams, SMS, Discord, PagerDuty, phone calls, webhooks, and more.
Can Better Stack manage incidents?
Yes. Better Stack includes incident management with escalation policies, on-call scheduling, and real-time notifications.
Is Better Stack suitable for beginners?
Absolutely. Its intuitive interface makes it easy for beginners to set up monitors, configure alerts, and manage incidents without extensive technical knowledge.
Conclusion
Better Stack simplifies infrastructure monitoring by combining uptime monitoring, log management, incident response, hosted status pages, and alerting into one unified platform. Instead of managing multiple monitoring tools, you can monitor your services, investigate issues, and respond to incidents from a single dashboard. Whether you’re monitoring a personal website or a large production environment, Better Stack helps improve reliability and reduce downtime.
Ready to Monitor Your Infrastructure with Confidence?
Start using Better Stack today by creating your first monitor, configuring real-time alerts, and tracking your website, API, or server from a single dashboard. As your infrastructure grows, explore advanced features like log management, hosted status pages, and incident escalation to build a more reliable and resilient monitoring workflow.